
Quick Answer: A PCBA defect Pareto analysis categorizes manufacturing errors to reveal that 80% of your rework costs stem from just 20% of defect types, typically solder paste issues. Implementing this 80/20 data tracking reduces overall assembly defect rates from typical 2-3% levels down to below 0.5% within two production batches.
Key takeaways:
- Require defect data in CSV format, not just non-editable PDFs.
- 60-90% of SMT defects originate during the solder paste printing phase.
- Normalize defects using IPC-9261 DPMO to compare boards accurately.
- A sudden shift in the top defect signals process drift, not random chance.
Table of Contents
- 1. What Is Defect Pareto Analysis and Why Do Most CMs Skip It?
- 2. How Do You Classify PCB Assembly Defects for Meaningful Analysis?
- 3. What Are the Top 10 SMT Defects and Their Typical Root Causes?
- 4. How Do You Build a Defect Pareto Chart From CM Quality Data?
- 5. What Should You Do When the Top Defect Changes Between Production Batches?
- 6. How Do You Use Pareto Data to Negotiate Process Improvements With Your CM?
- 7. What Defect Tracking Should You Demand in Your CM’s Quality Report?
- 8. Beyond Pareto: When You Need Root Cause Tools (Fishbone, 5 Whys, FMEA)
Getting a quality report showing a 1.2% failure rate tells you nothing about what to fix. You see three bridged pins, five misaligned components, and some tombstoning, leaving you completely overwhelmed by random data points. We fix this noise with pcba defect pareto analysis, a mathematical method that forces your CM to stop guessing and target the exact machine causing the most pain. At QueenEMS, we maintain a 99.7% first-pass yield rate because we track every single defect category to its root cause before the next batch starts.
1. What Is Defect Pareto Analysis and Why Do Most CMs Skip It?
Defect Pareto analysis is an 80/20 sorting method that ranks PCB assembly errors by frequency, proving that solving the top 2 out of 10 defect types eliminates 80% of total rework costs. Most CMs avoid providing this detailed breakdown, citing “proprietary processes” or “too much overhead,” because the data directly exposes their specific machine calibration failures.
- CMs prefer hiding behind an “overall 1.2% defect rate” to avoid accountability.
- It forces the CM to admit that 40% of their errors come from one badly maintained stencil printer.
- It requires raw CSV data exports instead of easily manipulated PDF summaries.
Here is the hard truth: If your CM refuses to provide categorized defect counts, they are actively hiding a systemic process failure.
Bottom line: Never accept a generic defect percentage; explicitly write the requirement for categorized defect data into your master procurement contract before production begins.
2. How Do You Classify PCB Assembly Defects for Meaningful Analysis?
Classifying pcb assembly defect analysis data effectively requires tracking defects across 5 distinct dimensions: defect type, process step, component package, board location, and production shift. A flat list of 50 “solder bridges” is useless until you classify that 45 of them occurred on the exact same QFN package during the night shift.
| Dimension | What It Reveals | When to Use It |
|---|---|---|
| By Defect Type | The physical nature of the error (e.g., bridging, voids). | Initial high-level quality sorting. |
| By Process Step | Which machine is failing (e.g., Printer, Pick & Place). | Pinpointing factory equipment issues. |
| By Component Type | Package-specific vulnerabilities (e.g., 0402 vs BGA). | Adjusting specific machine nozzle pressures. |
| By Board Location | Layout or thermal mass design flaws. | Updating the DFM layout guidelines. |
| By Operator/Shift | Human error or fatigue factors. | Assigning targeted training sessions. |
Choose classification by “defect type” to fix general machine parameters, but choose classification by “board location” if you suspect a specific DFM layout flaw.

Bottom line: Demand multi-dimensional classification in your quality reports so you can pinpoint exactly when and where the factory process failed.
3. What Are the Top 10 SMT Defects and Their Typical Root Causes?
The top SMT defects include solder bridging, insufficient paste, and tombstoning, which together regularly account for 60-90% of total assembly failures. According to the SMTA, these primary defect categories almost exclusively originate at the solder paste printing stage, proving that poor stencil setup is the biggest quality killer.
| Defect Type | Typical % of Total | Primary Root Cause | Process Fix |
|---|---|---|---|
| Solder Bridging | 25% – 35% | Stencil aperture too large | Reduce aperture ratio to 0.9:1 |
| Insufficient Paste | 20% – 30% | Clogged stencil / low pressure | Clean stencil every 10 boards |
| Tombstoning | 10% – 15% | Uneven pad heating / paste | Fix pad asymmetry in DFM |
| Component Misalignment | 5% – 10% | Pick & Place vision error | Recalibrate machine camera |
| Cold Solder Joint | 5% – 8% | Insufficient reflow heat | Extend thermal soak zone |
Choose stencil aperture reduction to cure heavy solder bridging, but choose a prolonged thermal soak profile to cure cold solder joints. You can learn more about how paste drives quality in our guide on how to avoid PCBA defects soldering paste.
Bottom line: If your top pcba defects don’t involve solder paste printing, your CM is either misclassifying the errors or hiding a massive component placement issue.
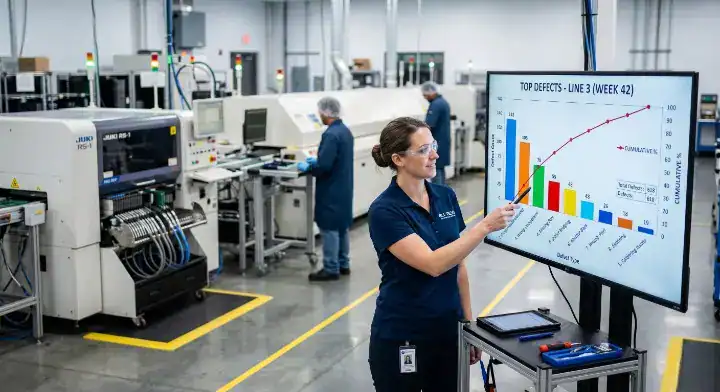
4. How Do You Build a Defect Pareto Chart From CM Quality Data?
Building a Pareto chart requires plotting defect categories on the X-axis by descending frequency, while a line graph plots the cumulative percentage reaching 100%. To make this data comparable across different board complexities, you must normalize the raw counts using the IPC-9261 standard to calculate Defects Per Million Opportunities (DPMO).
DPMO (Defects Per Million Opportunities) is a normalized metric that calculates error rates based on board complexity. A standard 4-layer board might target 50 DPMO, allowing you to compare its quality directly against a complex 12-layer server board.
| Defect Category | Defect Count | Cumulative Count | Cumulative % |
|---|---|---|---|
| Solder Bridging | 45 | 45 | 45.0% |
| Tombstoning | 25 | 70 | 70.0% |
| Missing Component | 15 | 85 | 85.0% |
| Cold Joint | 10 | 95 | 95.0% |
| Misalignment | 5 | 100 | 100.0% |
Choose raw defect counts for quick daily factory floor adjustments, but choose DPMO normalization when comparing the first pass yield benchmark between two entirely different product designs.
Bottom line: Force your CM to supply the cumulative percentage line, as this visually dictates exactly which two defects require immediate engineering intervention.
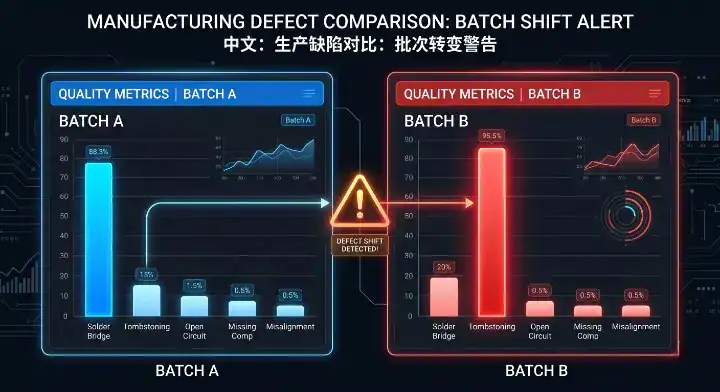
5. What Should You Do When the Top Defect Changes Between Production Batches?
When a top defect shifts abruptly—such as solder bridging dropping from 30% to 15% while how to prevent tombstoning spikes to 35%—it signals an unauthorized process drift rather than random statistical variation. Any sudden emergence of a new top defect means the CM altered a machine parameter, swapped a material, or changed the reflow profile without your approval.
Factory Case Study: An IoT gateway client had stable production for 6 months, with solder bridging as the top defect at a low 0.3% rate. In month 7, BGA voiding suddenly jumped to 0.5%. The CM claimed it was “within spec.” We disagreed. A sudden shift is a process change signal. We investigated and found the CM had switched solder paste suppliers 3 weeks earlier without notification. The new paste had higher flux, which reduced bridging but caused severe voiding. We reverted to the original paste, and voiding dropped back to baseline.
- New top defect emerges: Signals a new material or uncalibrated machine.
- Total volume increases: Signals general machine degradation or maintenance skipped.
- Multiple defects rise together: Signals a catastrophic environmental change, like factory humidity loss.
Bottom line: Treat any sudden shift in the top defect category as an unauthorized factory change and immediately audit the CM’s material logs.
6. How Do You Use Pareto Data to Negotiate Process Improvements With Your CM?
Using Pareto data transforms your CM negotiations from emotional complaints into hard engineering mandates, allowing you to target the specific 20% of processes causing 80% of your scrap costs. Instead of vaguely asking the CM to “improve quality,” you use the 80/20 data to demand specific stencil modifications or nozzle replacements.
Factory Case Study: A consumer electronics client had a stubborn 2.1% defect rate. Their CM kept saying, “We are working on it.” We built a proper Pareto chart from their raw data: 43% of defects were tombstoning on 0402 capacitors, 28% were bridging on a specific QFP, and 19% were cold joints. We demanded three targeted fixes: pad asymmetry correction for the 0402s, reducing the QFP stencil aperture to 0.8:1, and replacing the selective solder nozzle. Within two batches, the combined defect rate dropped to 0.4%.
- Move from “fix the boards” to “fix the stencil aperture.”
- Move from “train the operators” to “install a physical poke-yoke fixture.”
- Move from “check it better” to “program the AOI to catch this specific 15% shift.”
Bottom line: Stop asking your CM to “do better” and start using Pareto charts to assign specific engineering tasks with hard deadlines.
7. What Defect Tracking Should You Demand in Your CM’s Quality Report?
A usable CM quality report must provide raw, editable data formats like CSV or Excel rather than locked PDFs, including specific fields for batch IDs, total units inspected, and defects categorized by exact process steps. If your supplier refuses to provide editable trend data and high-resolution defect photos, they are actively blocking your ability to perform continuous improvement.
For prototype runs (5-10 boards): demand a basic defect count table. For mid-volume (100-500 boards): demand Pareto charts categorized by process step. For high-volume (1000+ boards): demand full DPMO normalization data.
| Required Item | Why It Is Critical | Red Flag If Missing |
|---|---|---|
| Raw Data (CSV/Excel) | Allows you to build custom pivot tables. | CM only sends locked PDFs. |
| Defect by Category | Identifies the 80/20 split. | Groups everything as “Visual Reject”. |
| Process Step Origin | Locates the failing machine. | Blames “Operator Error” entirely. |
| High-Res Photos | Proves the physical failure mechanism. | Blurry images or no visual proof. |
Choose PDF formats only for the executive narrative summary, but demand raw CSV files for actual defect tracking and data manipulation.
Bottom line: Reject any quality report that only provides a locked PDF with total failure percentages; demand the raw category data required to run your own analysis.
8. Beyond Pareto: When You Need Root Cause Tools (Fishbone, 5 Whys, FMEA)
While a Pareto chart identifies what the biggest problem is, you must deploy 5 Whys to find the human system failure, Fishbone diagrams to map the environmental variables, and FMEA to predict future risks. The Pareto tells you that solder bridging costs you $5,000 a month, but the 5 Whys reveals that the bridging happens because the operator cleans the stencil with the wrong solvent.
| Situation | Which Tool to Use | Why It Works |
|---|---|---|
| Finding the biggest financial loss | Pareto Chart | Ranks problems by frequency/cost. |
| Mapping physical variables | Fishbone (Ishikawa) | Categorizes Man, Machine, Material, Method. |
| Finding the system failure | 5 Whys | Pushes past the symptom to the true root. |
| Predicting future failures | FMEA | Evaluates severity and occurrence before production. |
Choose a Pareto chart to identify which defect is costing the most money, but choose a Fishbone diagram when you need to brainstorm the physical variables causing that specific defect.
Bottom line: Use the Pareto chart to point the sniper rifle, and use the 5 Whys method to actually pull the trigger on the root cause.
FAQ
What is a PCBA defect Pareto analysis? It is a quality control method that categorizes PCB assembly errors by frequency, demonstrating that 80% of manufacturing defects stem from just 20% of root causes. It tells you exactly which machine to fix first. Start demanding this data on your next production run.
Why do most CMs skip providing Pareto charts? Most CMs skip it because generating detailed data requires overhead, and more importantly, it exposes their specific machine calibration flaws. They prefer giving an overall percentage to avoid blame. Update your contract to require raw defect CSV files.
What are the top SMT defects found in Pareto charts? Solder bridging, insufficient paste, and tombstoning are the top defects, consistently accounting for 60% to 90% of all SMT failures. These usually originate at the stencil printer. Audit your CM’s paste printing process today.
How do you read a Pareto chart? Yes, you read the vertical bars to see which defect occurs most often, and you follow the line graph to identify the cumulative percentage. Focus all your engineering resources on the first two or three bars that make up the 80% mark. Ignore the minor defects until the big ones are solved.
What does it mean when the top defect shifts suddenly? A sudden shift means the factory changed a process, swapped a material, or a machine fell out of calibration. It is almost never a random occurrence. Demand a full material and process log audit immediately.
Choosing the right data analysis method is the difference between endlessly reworking boards and permanently fixing the factory line. You need a partner who uses data to hunt down defects, not hide them.
At QueenEMS, we offer Free DFM/DFA engineering reviews on every order to eliminate layout-induced defects before they hit the floor. We utilize up to 60-layer PCB fabrication capabilities and perform 3D AOI and X-Ray inspection on every single BGA joint. From prototype to mass production scaling, we provide full turnkey service and transparent, Pareto-driven quality reporting. Stop chasing generic defect rates. Contact us at QueenEMS to build a data-driven manufacturing partnership for your hardware.
Written by the QueenEMS Engineering Team.
Upload your files today · Free DFM check before production · Ship worldwide
Get your PCB prototypes in as fast as 24 hours. We handle FR4, Rogers, and Flex up to 60 layers — free prototypes for 2–4 layer boards, no minimum order.
Just upload your Gerber + BOM — we source every part, assemble, and inspect (AOI + X‑Ray) so you don't have to chase suppliers. Boards ship in as fast as 24 hours.