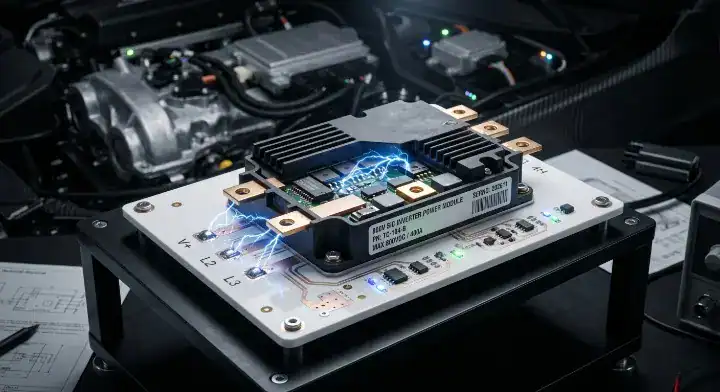
Quick Answer: Select a ceramic PCB for an 800 V EV power stage from the actual DC-link range, switching losses, insulation barriers, cooling arrangement and mechanical duty. Si3N4 AMB is a relevant candidate for demanding power modules, but an 800 V label does not automatically require that material or guarantee a power-density improvement. Compare complete substrate stacks and validate them in the intended inverter assembly.
A ceramic power-module substrate for 800V EV power electronics sits between several competing requirements. Thin dielectric can shorten the thermal path, while insulation, handling and attachment may favor another construction. Faster switching can reduce some losses yet make parasitic inductance and common-mode coupling more consequential. The material choice has to fit that circuit and package together.
Avoid starting from a claim that one substrate gives every vehicle a fixed lifetime. Start from the inverter schematic, loss calculation, cooling boundary and mechanical drawing. Those inputs explain what the ceramic must do and which evidence would justify paying for a different stack.
Table of Contents
- Start with the voltage range and switching circuit
- Place the ceramic inside the real thermal path
- Keep power substrates and control boards separate
- Compare candidate stacks instead of material slogans
- Treat insulation as a finished assembly requirement
- Account for the complete mechanical assembly
- Match validation to the failure mechanisms
- Make the substrate choice traceable to the inverter design
Start with the voltage range and switching circuit
Use the maximum and minimum operating DC-link voltage, expected transients and circuit topology. Nominal battery voltage is a system description, not a complete semiconductor or insulation rating.
A simple hypothetical comparison shows one effect of higher voltage. Delivering 100 kW at a steady 400 V requires 250 A from the DC link under the ideal relation P = V × I. At 800 V, the corresponding current is 125 A. For the same conductor resistance, the I²R loss associated with that current would be one quarter. These calculations assume equal transmitted power and resistance and omit converter losses and ripple.
That arithmetic does not establish three times the inverter power density. Semiconductor selection, modulation, switching frequency, capacitor design, cooling and package volume all affect the result. Nor is DC-link current identical to every phase or device current in the inverter. Use the circuit’s actual waveforms for conductor and device-loss calculations.
Switching overshoot also needs a margin. Parasitic loop inductance produces a voltage contribution related to L × di/dt, so changes in busbar, capacitor placement or module interconnection can change peak device voltage. Keep those loop elements visible when selecting the substrate layout; ceramic thermal conductivity cannot compensate for an inadequately controlled switching loop.
The substrate decision should therefore begin with a circuit envelope: operating voltage, transient assumptions, device ratings, load-current waveforms and the layout elements that form the commutation loop. A single “800 V compatible” line in a quotation leaves most of that envelope undefined.
Check more than the nominal operating point. The maximum charged-battery voltage, regenerative operation and the switching event being evaluated may create different electrical conditions. A development switching test should identify probe connection, circuit layout, current and temperature so an observed peak can be compared with the model. Changing the substrate layout after that test can change the loop geometry; preserve the tested arrangement or review the resulting electrical difference. This avoids qualifying a compact prototype and then assuming that a differently routed production module has the same switching margin.
Place the ceramic inside the real thermal path
Treat the ceramic as one part of the heat path from semiconductor junction to coolant or ambient. Removing a weak interface can matter more than changing the ceramic’s bulk conductivity.
Distinguish device ratings from operating temperatures
A device’s maximum junction-temperature rating is not a required operating temperature, and it is not the temperature of every layer beneath the die. Determine losses at the intended electrical conditions, then calculate or measure the temperatures reached in the assembled module. Attach materials, interconnections and insulation can impose additional limits.
For short load changes, use a transient thermal model that matches the package and cooling boundary. A steady-state resistance can describe a sustained condition but does not capture the complete time response. State whether the reference is case, cooler surface or coolant so two reported thermal values can be compared meaningfully.
Infineon’s discussion of SiC module packaging identifies die attachment and interconnection as contributors to thermal and cycling performance. Its device-specific improvements should not be turned into generic gains from changing the ceramic alone.
Allocate a thermal resistance budget
Consider an illustrative steady-state design with 80 W dissipated in a defined heat path, a 70°C cooling reference and a chosen 150°C junction target. The allowable total resistance for that simplified path is (150 − 70) / 80 = 1.0 K/W. These are assumed design inputs, not vehicle test data or a recommended operating limit.
If identified package and interface contributions already consume 0.8 K/W, only 0.2 K/W remains for the other modeled contributions. Improving a ceramic term that is already small may provide little benefit, while correcting an unexpectedly thick thermal interface may be decisive. Verify the partition and avoid double-counting a substrate already included in a module data-sheet value.
For several nearby devices, include their simultaneous losses and thermal interaction. A single-device calculation with the neighbours unpowered can understate the temperature reached in a shared substrate or cooler. Retain the loss distribution used for the worst relevant operating condition.
Use the power-module substrate selection article for the broader material and route comparison. Here, the thermal budget connects that choice to the actual inverter losses and cooler.
Keep power substrates and control boards separate
Identify which board carries the power die, which carries packaged switches and which carries control or gate-drive circuitry. An 800 V vehicle can contain several board constructions with different responsibilities.
A ceramic power substrate can provide the insulating heat path within a module, while an organic circuit board connects drivers, sensors and control functions. It is incorrect to claim that an FR4 gate-driver board necessarily causes a vehicle fire or that every polymer layer becomes unusable because the semiconductor has a high junction rating.
Infineon’s Power Modules for Onboard Chargers describes a specific arrangement combining a ceramic-based power module, a heatsink interface and connections to an FR4 PCB. It demonstrates the value of separating the package functions rather than choosing one material for the complete vehicle.
Review the insulation and return paths at the boundary between those boards. A gate-driver connection can cross an isolation barrier even when it carries little average power. Mechanical connectors, fasteners and exposed metal must be included in that review, as must the permitted motion between the power module and the control assembly.
Do not assign substrate material solely by converter name or rated output power. An onboard charger can use different switching topologies and packages. A traction inverter can have a different cooling arrangement from another inverter at the same nominal voltage. Assess the delivered construction rather than relying on a universal OBC-versus-inverter material table.
Compare candidate stacks instead of material slogans
Compare identified ceramic grades with their metal layers, thicknesses and attachment surfaces. A property table for bare ceramics is a starting point, not a ranking of complete modules.
AlN can offer a high-conductivity path, while Si3N4 grades can offer useful mechanical properties for demanding bonded-copper structures. Alumina-based constructions also remain relevant where their thermal and mechanical performance meets the design. No material family is restricted by definition to stationary equipment or to road vehicles.
The Rogers curamik product data, ©2026 illustrates several material and thickness combinations and identifies both DBC and AMB routes. Its selection is evidence of available supplier constructions, not proof that QueenEMS produces every listed option.
For each viable candidate, retain the following comparison fields:
- Ceramic grade and thickness, with property conditions.
- Copper thickness, pattern and process route.
- Die-attach and cooler-interface geometry.
- Finished insulation and mechanical requirements.
- Measurements or models supporting the predicted temperatures and stresses.
A thinner ceramic may change the conduction term without reproducing the stiffness or insulation behavior of a thicker one. Thick copper can improve current distribution and heat spreading while also changing the composite’s mechanical response. Compare those trade-offs explicitly before calling one stack superior.
The Si3N4-versus-AlN decision article includes a reproducible thickness/conductivity comparison. Its calculation helps screen options; the inverter assembly still requires its own validation.
Treat insulation as a finished assembly requirement
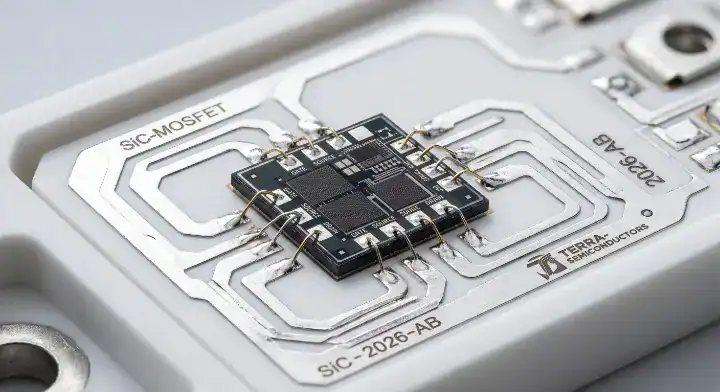
Map the insulation barriers and check their geometry after assembly. Bulk ceramic dielectric strength alone cannot establish the performance of exposed edges, interfaces, encapsulation or a mounted cooler.
Map each insulation barrier
Identify the energized copper, low-voltage circuitry, accessible conductive parts and cooling structure. Mark through-thickness insulation, surface creepage and air clearance as distinct paths. Include the effects of attachment materials, finish, fasteners and contamination controls where they influence those paths.
Set test voltages, waveform, duration and acceptance from the applicable product requirements and approved plan. A generic 3 kV for one minute requirement does not automatically qualify every 800 V construction. Test-fixture geometry and the state of the assembly should be recorded so the result can be reproduced.
The ceramic dielectric-strength article explains the difference between material properties and finished insulation. That distinction prevents a convenient catalogue number from replacing the product’s actual barrier assessment.
Review fast switching and parasitic capacitance
The copper-to-cooler geometry can create a capacitive path even while providing DC insulation. Under the simplified relationship i = C × dv/dt, changing the capacitance or switching slew rate changes the displacement-current contribution. This is a circuit relationship, not a prediction that one ceramic material will solve an EMC problem.
A thermal revision can therefore need an electrical comparison before approval. Take an illustrative inverter design in which a thinner ceramic is proposed to improve the junction-to-cooler path. Keep the switching-node copper overlap visible on both drawings, and estimate how the thickness change affects capacitance to the grounded cooler. That estimate screens the concern; it does not establish an EMC result.
In the development comparison, record switching slew rate and the relevant common-mode current alongside the thermal result, using the intended cooler grounding and representative interconnections. Changing gate resistance, grounding or cable routing at the same time would complicate attribution. If temperature improves while disturbance current increases, examine overlap geometry and the return path before accepting the thermal change alone. Any proposed remedy needs another electrical and thermal check: slowing the switching edge, for example, changes the loss calculation that justified the substrate. Approval should connect those measurements to the converter requirements, rather than treating a lower device temperature as evidence that insulation and interference concerns are also resolved.
Partial-discharge and insulation investigations also need a defined test arrangement and criteria where required by the product plan. Do not interpret one clean withstand test as proof that every relevant electrical-aging mechanism has been evaluated. Record which question each test answers and where the remaining validation belongs.
Account for the complete mechanical assembly
Evaluate the ceramic together with copper, die attach, terminals, baseplate, cooler and mounting hardware. The CTE mismatch and joint-failure investigation examines the attachment interfaces where differential movement is transferred. A bare-material CTE that is close to the semiconductor does not produce a stress-free module.
The apparent expansion of a metallized structure differs from that of the ceramic alone. The Rogers data sheet explicitly qualifies its ceramic CTE values and notes a copper-dependent change. Si and SiC should also not be treated as the same material with one exact CTE. Use the property data appropriate to the actual die, temperature interval and model.
Mounting creates another load path. Fastener locations, support surfaces and interface materials determine how the substrate is restrained. Follow the module or assembly mounting specification, including its sequence and contact conditions. A stronger ceramic does not make arbitrary clamping loads acceptable.
Vibration assessment should represent the installed assembly, including heavy terminals, busbars and coolant connections. A small bare substrate held in a laboratory fixture does not reproduce the mass or restraints of the inverter. Look for the particular location where the model or development test predicts damage rather than prescribing Si3N4 solely because the product moves on a road.
Changes to the cooler can require renewed review even when the ceramic drawing remains unchanged. A different attachment surface, flow arrangement or mounting stiffness can affect temperatures and mechanical loading. Preserve the validated boundary conditions alongside the substrate choice.
Match validation to the failure mechanisms
Choose tests to address the expected electrical, thermal and mechanical failure mechanisms at the correct assembly level. A material name or quality-system certificate cannot replace those tests.
Environmental exposure and powered operation
ECPE AQG 324, Release 04.1/2025 covers power-module qualification and includes a SiC annex. It distinguishes environmental and lifetime tests and does not replace qualification of the complete vehicle converter. Select the applicable scope and customer requirements before adopting a test condition.
Environmental cycling and active power cycling challenge the assembly differently. Record junction-temperature excursions, cooling conditions, switching or current loading and the interfaces being monitored. Converting a chamber result directly into years of vehicle service requires an appropriate lifetime model and mission profile; it cannot be inferred from reaching a convenient cycle count.
Use baseline and post-test electrical, thermal and physical measurements that can detect the intended changes. Visual inspection remains useful for accessible damage, while suitable acoustic or X-ray methods can address selected internal features. No single image proves that every interface is void-free or immune to future degradation.
Supplier certification and product qualification
IATF 16949 concerns an automotive quality management system. AEC-Q100 and AEC-Q200 address different component categories, as listed by the AEC documentation index. These labels should not be presented as interchangeable certifications of a bare ceramic board.
Check certificate identity and scope separately from the product test report. The report should identify the tested construction, lot, quantity, procedure, measurements and limitations. A real certificate can support supplier evaluation while leaving the application’s substrate performance to be demonstrated.
A quotation claiming complete acoustic screening should identify the inspected interfaces, detectable defect and delivered records. A retained peel-strength requirement needs the test method, construction and conditioning attached. Put that agreed work into the inspection plan so purchasing can verify what the supplier will deliver and quality can judge the resulting evidence.
Make the substrate choice traceable to the inverter design
The final choice should explain which candidate meets the circuit, cooling, insulation and mechanical requirements, and which uncertainties remain to be tested. Price comparison becomes meaningful after those conditions are aligned.
Retain the loss-model inputs, thermal boundary, electrical-barrier drawing, selected stack and mounting arrangement with the prototype results. A lower quote based on a different copper thickness or inspection scope is a different proposal. Compare it as such rather than treating the price difference as pure material savings.
Warranty-cost estimates need field data or a justified reliability model. A stronger cycling result can support a design choice, but a predicted reduction in vehicle failures needs a defensible connection to the mission profile and actual failure mechanisms. A service-life target must be evaluated through that application evidence; conductivity and toughness alone cannot establish the number of years a module will last.
For an 800 V power-stage quotation, provide QueenEMS with the operating-voltage range, device and loss information, substrate pattern, cooler interface and qualification requirements. The ceramic power-substrate service can use those inputs to discuss candidate constructions and the prototype or inspection scope to include in a quote.
Written by the QueenEMS Engineering Team
Upload your files today · Free DFM check before production · Ship worldwide
Get your PCB prototypes in as fast as 24 hours. We handle FR4, Rogers, and Flex up to 60 layers — free prototypes for 2–4 layer boards, no minimum order.
Just upload your Gerber + BOM — we source every part, assemble, and inspect (AOI + X‑Ray) so you don't have to chase suppliers. Boards ship in as fast as 24 hours.